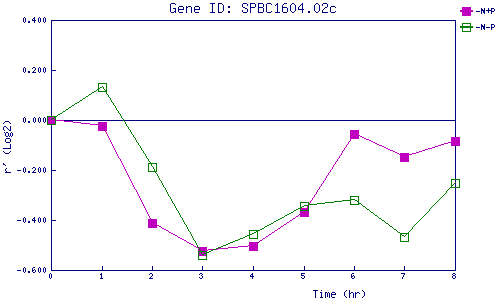
| 0 | 1 | 2 | 3 | 4 | 5 | 6 | 7 | 8 | |
| -N+P | 0.000 | -0.025 | -0.412 | -0.525 | -0.502 | -0.367 | -0.057 | -0.148 | -0.083 |
| -N-P | 0.000 | 0.131 | -0.189 | -0.540 | -0.456 | -0.343 | -0.320 | -0.468 | -0.253 |
|
-N+P: Nitrogen starved in the presence of P-factor -N-P: Nitrogen starved in the absence of P-factor |