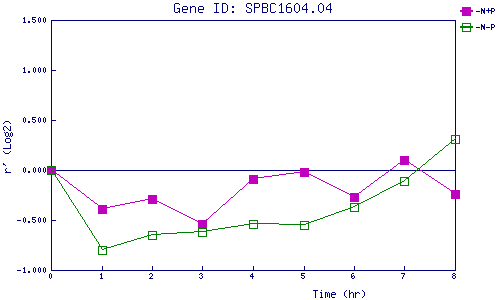
| 0 | 1 | 2 | 3 | 4 | 5 | 6 | 7 | 8 | |
| -N+P | 0.000 | -0.392 | -0.286 | -0.543 | -0.087 | -0.025 | -0.272 | 0.105 | -0.241 |
| -N-P | 0.000 | -0.797 | -0.654 | -0.617 | -0.538 | -0.550 | -0.368 | -0.111 | 0.308 |
|
-N+P: Nitrogen starved in the presence of P-factor -N-P: Nitrogen starved in the absence of P-factor |