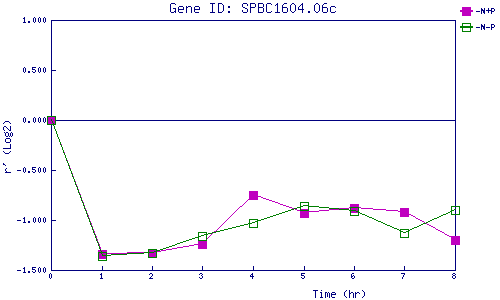
| 0 | 1 | 2 | 3 | 4 | 5 | 6 | 7 | 8 | |
| -N+P | 0.000 | -1.338 | -1.330 | -1.245 | -0.749 | -0.929 | -0.877 | -0.917 | -1.205 |
| -N-P | 0.000 | -1.356 | -1.331 | -1.164 | -1.030 | -0.859 | -0.913 | -1.129 | -0.903 |
|
-N+P: Nitrogen starved in the presence of P-factor -N-P: Nitrogen starved in the absence of P-factor |