imp1
| 0 | 1 | 2 | 3 | 4 | 5 | 6 | 7 | 8 | |
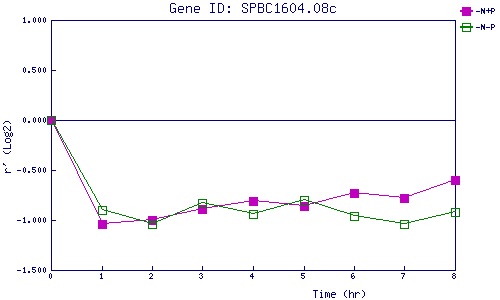
| -N+P | 0.000 | -1.045 | -1.001 | -0.889 | -0.809 | -0.861 | -0.734 | -0.778 | -0.605 |
| -N-P | 0.000 | -0.905 | -1.042 | -0.830 | -0.940 | -0.804 | -0.959 | -1.041 | -0.919 |
|
-N+P: Nitrogen starved in the presence of P-factor -N-P: Nitrogen starved in the absence of P-factor |
