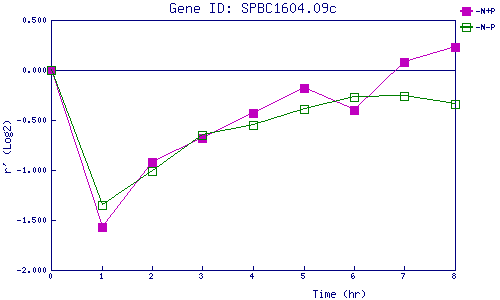
| 0 | 1 | 2 | 3 | 4 | 5 | 6 | 7 | 8 | |
| -N+P | 0.000 | -1.568 | -0.921 | -0.680 | -0.426 | -0.175 | -0.398 | 0.078 | 0.226 |
| -N-P | 0.000 | -1.350 | -1.015 | -0.647 | -0.548 | -0.387 | -0.272 | -0.256 | -0.345 |
|
-N+P: Nitrogen starved in the presence of P-factor -N-P: Nitrogen starved in the absence of P-factor |