srb7
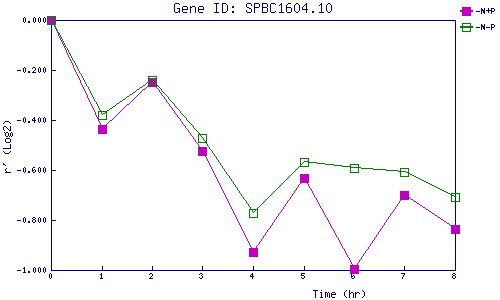
| 0 | 1 | 2 | 3 | 4 | 5 | 6 | 7 | 8 | |
| -N+P | 0.000 | -0.436 | -0.247 | -0.523 | -0.926 | -0.630 | -0.997 | -0.700 | -0.837 |
| -N-P | 0.000 | -0.381 | -0.241 | -0.470 | -0.773 | -0.566 | -0.590 | -0.606 | -0.709 |
|
-N+P: Nitrogen starved in the presence of P-factor -N-P: Nitrogen starved in the absence of P-factor |