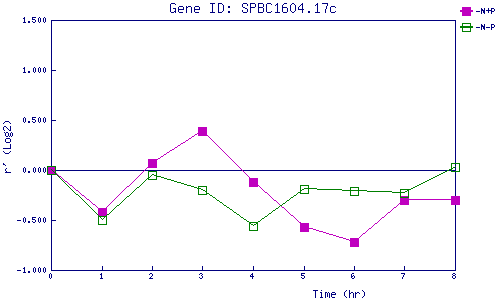
| 0 | 1 | 2 | 3 | 4 | 5 | 6 | 7 | 8 | |
| -N+P | 0.000 | -0.423 | 0.067 | 0.388 | -0.123 | -0.571 | -0.721 | -0.297 | -0.304 |
| -N-P | 0.000 | -0.505 | -0.052 | -0.201 | -0.557 | -0.187 | -0.210 | -0.232 | 0.028 |
|
-N+P: Nitrogen starved in the presence of P-factor -N-P: Nitrogen starved in the absence of P-factor |