tea2 klp4
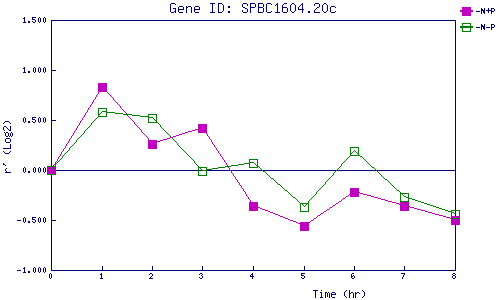
| 0 | 1 | 2 | 3 | 4 | 5 | 6 | 7 | 8 | |
| -N+P | 0.000 | 0.830 | 0.261 | 0.415 | -0.364 | -0.559 | -0.221 | -0.360 | -0.495 |
| -N-P | 0.000 | 0.576 | 0.517 | -0.013 | 0.071 | -0.369 | 0.190 | -0.273 | -0.440 |
|
-N+P: Nitrogen starved in the presence of P-factor -N-P: Nitrogen starved in the absence of P-factor |