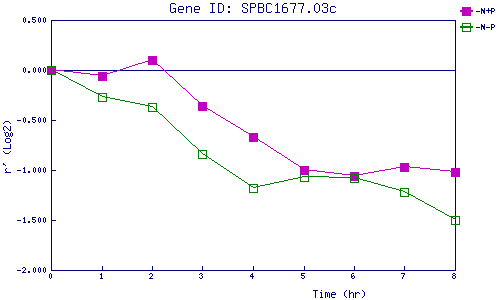
| 0 | 1 | 2 | 3 | 4 | 5 | 6 | 7 | 8 | |
| -N+P | 0.000 | -0.065 | 0.101 | -0.362 | -0.668 | -1.004 | -1.064 | -0.970 | -1.023 |
| -N-P | 0.000 | -0.269 | -0.374 | -0.845 | -1.176 | -1.069 | -1.080 | -1.217 | -1.505 |
|
-N+P: Nitrogen starved in the presence of P-factor -N-P: Nitrogen starved in the absence of P-factor |