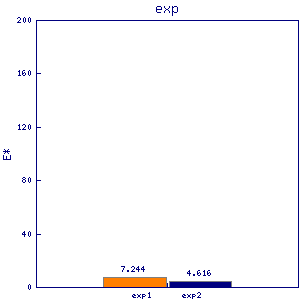
frp1
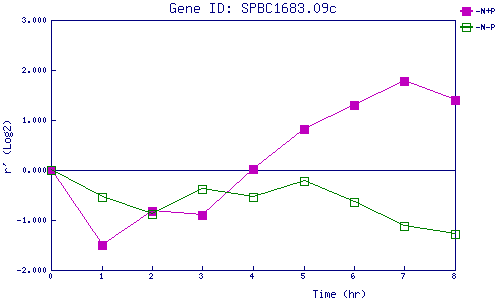
| 0 | 1 | 2 | 3 | 4 | 5 | 6 | 7 | 8 | |
| -N+P | 0.000 | -1.492 | -0.825 | -0.908 | 0.022 | 0.816 | 1.295 | 1.779 | 1.395 |
| -N-P | 0.000 | -0.536 | -0.879 | -0.371 | -0.532 | -0.219 | -0.639 | -1.122 | -1.277 |
|
-N+P: Nitrogen starved in the presence of P-factor -N-P: Nitrogen starved in the absence of P-factor |