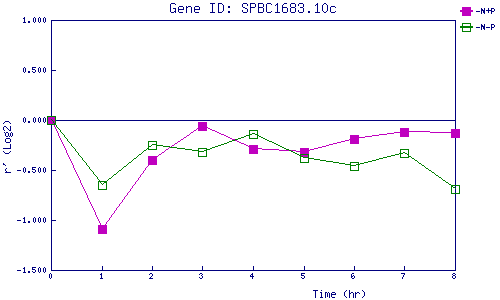
| 0 | 1 | 2 | 3 | 4 | 5 | 6 | 7 | 8 | |
| -N+P | 0.000 | -1.086 | -0.396 | -0.063 | -0.288 | -0.322 | -0.194 | -0.118 | -0.131 |
| -N-P | 0.000 | -0.653 | -0.252 | -0.321 | -0.140 | -0.377 | -0.456 | -0.330 | -0.686 |
|
-N+P: Nitrogen starved in the presence of P-factor -N-P: Nitrogen starved in the absence of P-factor |