rps29
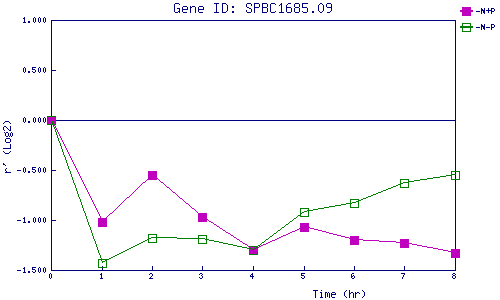
| 0 | 1 | 2 | 3 | 4 | 5 | 6 | 7 | 8 | |
| -N+P | 0.000 | -1.025 | -0.552 | -0.974 | -1.297 | -1.067 | -1.196 | -1.226 | -1.333 |
| -N-P | 0.000 | -1.426 | -1.179 | -1.188 | -1.297 | -0.920 | -0.827 | -0.628 | -0.553 |
|
-N+P: Nitrogen starved in the presence of P-factor -N-P: Nitrogen starved in the absence of P-factor |