rps27
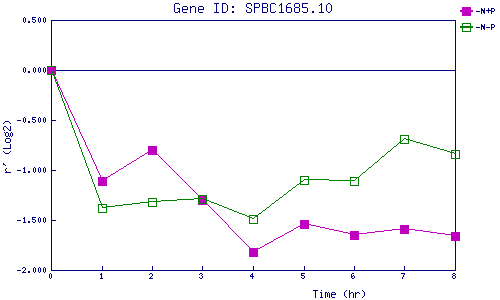
| 0 | 1 | 2 | 3 | 4 | 5 | 6 | 7 | 8 | |
| -N+P | 0.000 | -1.113 | -0.797 | -1.295 | -1.820 | -1.542 | -1.648 | -1.589 | -1.662 |
| -N-P | 0.000 | -1.377 | -1.319 | -1.289 | -1.490 | -1.098 | -1.113 | -0.690 | -0.839 |
|
-N+P: Nitrogen starved in the presence of P-factor -N-P: Nitrogen starved in the absence of P-factor |