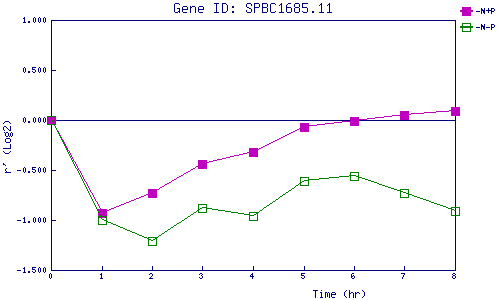
| 0 | 1 | 2 | 3 | 4 | 5 | 6 | 7 | 8 | |
| -N+P | 0.000 | -0.928 | -0.726 | -0.435 | -0.325 | -0.068 | -0.010 | 0.051 | 0.093 |
| -N-P | 0.000 | -0.996 | -1.213 | -0.876 | -0.959 | -0.609 | -0.557 | -0.729 | -0.914 |
|
-N+P: Nitrogen starved in the presence of P-factor -N-P: Nitrogen starved in the absence of P-factor |