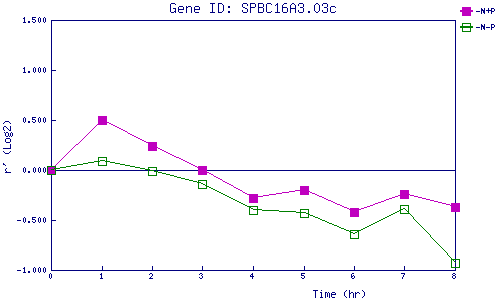
| 0 | 1 | 2 | 3 | 4 | 5 | 6 | 7 | 8 | |
| -N+P | 0.000 | 0.502 | 0.244 | -0.004 | -0.281 | -0.197 | -0.421 | -0.245 | -0.372 |
| -N-P | 0.000 | 0.088 | -0.011 | -0.136 | -0.400 | -0.428 | -0.638 | -0.394 | -0.928 |
|
-N+P: Nitrogen starved in the presence of P-factor -N-P: Nitrogen starved in the absence of P-factor |