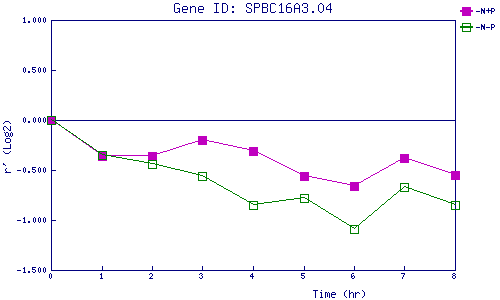
| 0 | 1 | 2 | 3 | 4 | 5 | 6 | 7 | 8 | |
| -N+P | 0.000 | -0.364 | -0.365 | -0.205 | -0.312 | -0.556 | -0.663 | -0.381 | -0.552 |
| -N-P | 0.000 | -0.353 | -0.439 | -0.562 | -0.853 | -0.781 | -1.087 | -0.669 | -0.853 |
|
-N+P: Nitrogen starved in the presence of P-factor -N-P: Nitrogen starved in the absence of P-factor |