rae1
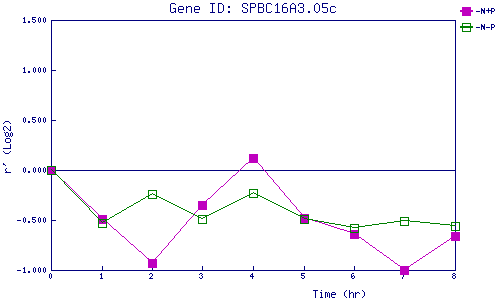
| 0 | 1 | 2 | 3 | 4 | 5 | 6 | 7 | 8 | |
| -N+P | 0.000 | -0.486 | -0.934 | -0.352 | 0.125 | -0.483 | -0.636 | -0.995 | -0.659 |
| -N-P | 0.000 | -0.533 | -0.241 | -0.487 | -0.229 | -0.491 | -0.585 | -0.509 | -0.559 |
|
-N+P: Nitrogen starved in the presence of P-factor -N-P: Nitrogen starved in the absence of P-factor |