| 0 | 1 | 2 | 3 | 4 | 5 | 6 | 7 | 8 | |
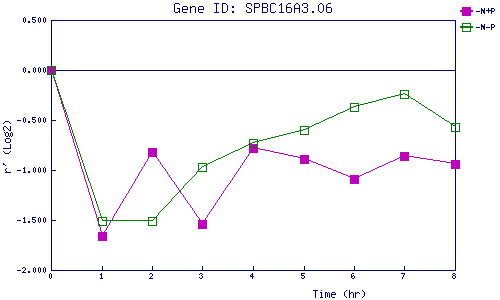
| -N+P | 0.000 | -1.656 | -0.815 | -1.543 | -0.785 | -0.889 | -1.092 | -0.860 | -0.943 |
| -N-P | 0.000 | -1.508 | -1.513 | -0.971 | -0.727 | -0.600 | -0.368 | -0.242 | -0.572 |
|
-N+P: Nitrogen starved in the presence of P-factor -N-P: Nitrogen starved in the absence of P-factor |