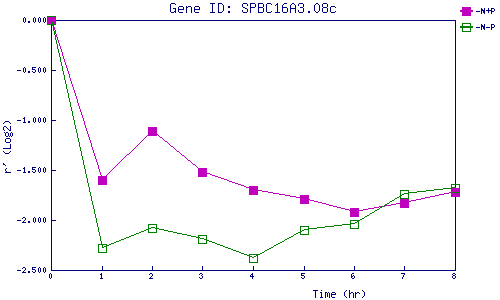
| 0 | 1 | 2 | 3 | 4 | 5 | 6 | 7 | 8 | |
| -N+P | 0.000 | -1.606 | -1.110 | -1.515 | -1.699 | -1.789 | -1.919 | -1.827 | -1.716 |
| -N-P | 0.000 | -2.283 | -2.082 | -2.193 | -2.383 | -2.099 | -2.045 | -1.744 | -1.681 |
|
-N+P: Nitrogen starved in the presence of P-factor -N-P: Nitrogen starved in the absence of P-factor |