eso1
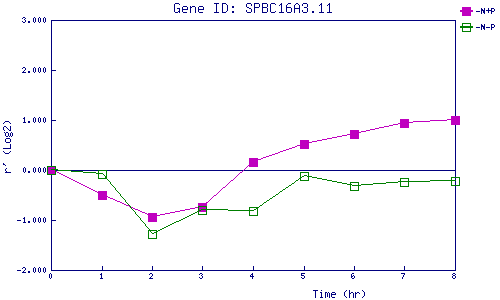
| 0 | 1 | 2 | 3 | 4 | 5 | 6 | 7 | 8 | |
| -N+P | 0.000 | -0.505 | -0.936 | -0.742 | 0.169 | 0.524 | 0.712 | 0.940 | 1.009 |
| -N-P | 0.000 | -0.083 | -1.288 | -0.794 | -0.820 | -0.122 | -0.310 | -0.231 | -0.222 |
|
-N+P: Nitrogen starved in the presence of P-factor -N-P: Nitrogen starved in the absence of P-factor |