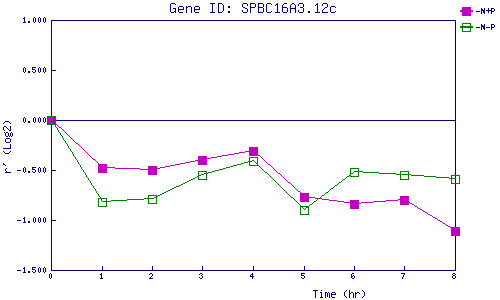
| 0 | 1 | 2 | 3 | 4 | 5 | 6 | 7 | 8 | |
| -N+P | 0.000 | -0.485 | -0.503 | -0.397 | -0.307 | -0.771 | -0.836 | -0.805 | -1.106 |
| -N-P | 0.000 | -0.819 | -0.792 | -0.547 | -0.412 | -0.899 | -0.522 | -0.554 | -0.590 |
|
-N+P: Nitrogen starved in the presence of P-factor -N-P: Nitrogen starved in the absence of P-factor |