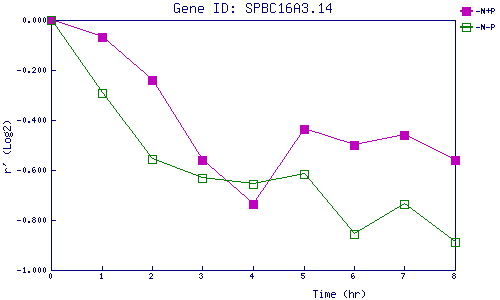
| 0 | 1 | 2 | 3 | 4 | 5 | 6 | 7 | 8 | |
| -N+P | 0.000 | -0.068 | -0.241 | -0.559 | -0.736 | -0.437 | -0.499 | -0.460 | -0.561 |
| -N-P | 0.000 | -0.291 | -0.556 | -0.634 | -0.657 | -0.616 | -0.854 | -0.736 | -0.887 |
|
-N+P: Nitrogen starved in the presence of P-factor -N-P: Nitrogen starved in the absence of P-factor |