nda2
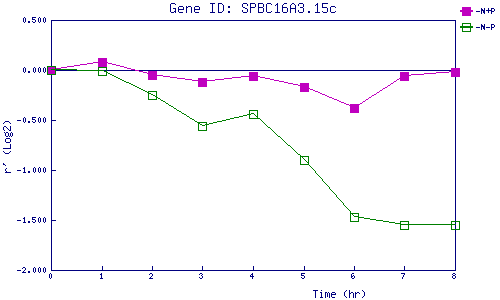
| 0 | 1 | 2 | 3 | 4 | 5 | 6 | 7 | 8 | |
| -N+P | 0.000 | 0.085 | -0.053 | -0.122 | -0.062 | -0.166 | -0.376 | -0.061 | -0.020 |
| -N-P | 0.000 | -0.014 | -0.248 | -0.560 | -0.443 | -0.905 | -1.468 | -1.554 | -1.546 |
|
-N+P: Nitrogen starved in the presence of P-factor -N-P: Nitrogen starved in the absence of P-factor |