vps1302 vps13b
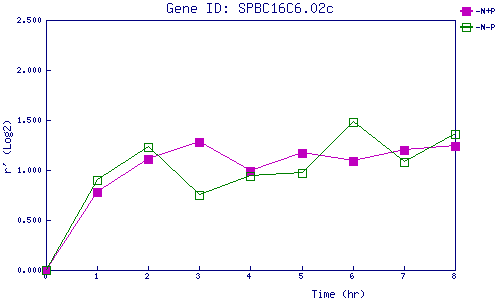
| 0 | 1 | 2 | 3 | 4 | 5 | 6 | 7 | 8 | |
| -N+P | 0.000 | 0.781 | 1.111 | 1.284 | 0.994 | 1.167 | 1.094 | 1.195 | 1.241 |
| -N-P | 0.000 | 0.905 | 1.235 | 0.749 | 0.945 | 0.966 | 1.477 | 1.083 | 1.357 |
|
-N+P: Nitrogen starved in the presence of P-factor -N-P: Nitrogen starved in the absence of P-factor |