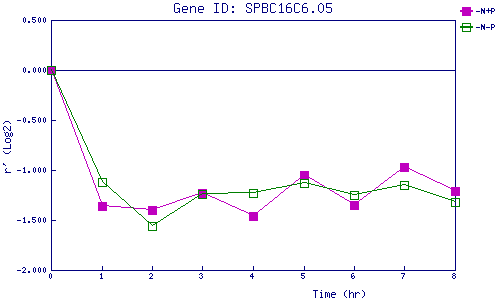
| 0 | 1 | 2 | 3 | 4 | 5 | 6 | 7 | 8 | |
| -N+P | 0.000 | -1.360 | -1.401 | -1.233 | -1.460 | -1.047 | -1.349 | -0.971 | -1.213 |
| -N-P | 0.000 | -1.120 | -1.555 | -1.239 | -1.227 | -1.128 | -1.254 | -1.151 | -1.318 |
|
-N+P: Nitrogen starved in the presence of P-factor -N-P: Nitrogen starved in the absence of P-factor |