chp2
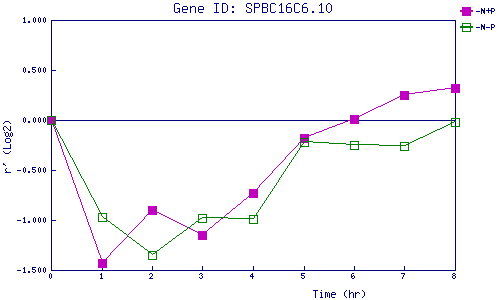
| 0 | 1 | 2 | 3 | 4 | 5 | 6 | 7 | 8 | |
| -N+P | 0.000 | -1.430 | -0.902 | -1.147 | -0.733 | -0.182 | 0.012 | 0.253 | 0.325 |
| -N-P | 0.000 | -0.966 | -1.349 | -0.983 | -0.992 | -0.216 | -0.251 | -0.263 | -0.018 |
|
-N+P: Nitrogen starved in the presence of P-factor -N-P: Nitrogen starved in the absence of P-factor |