rpl32-1 rpl3201
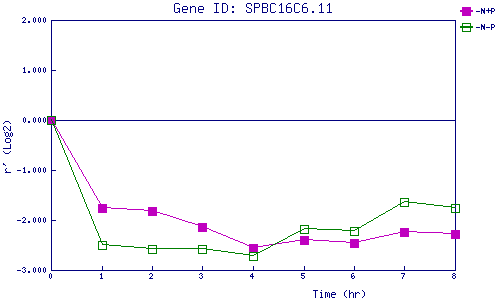
| 0 | 1 | 2 | 3 | 4 | 5 | 6 | 7 | 8 | |
| -N+P | 0.000 | -1.750 | -1.823 | -2.134 | -2.555 | -2.408 | -2.463 | -2.243 | -2.273 |
| -N-P | 0.000 | -2.493 | -2.575 | -2.583 | -2.726 | -2.176 | -2.228 | -1.631 | -1.770 |
|
-N+P: Nitrogen starved in the presence of P-factor -N-P: Nitrogen starved in the absence of P-factor |