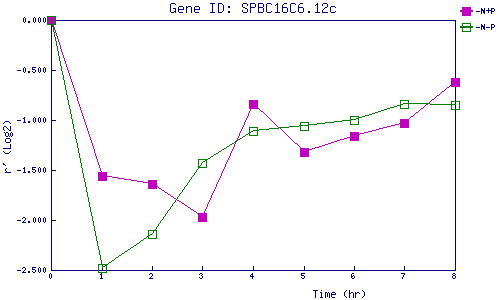
| 0 | 1 | 2 | 3 | 4 | 5 | 6 | 7 | 8 | |
| -N+P | 0.000 | -1.562 | -1.637 | -1.971 | -0.841 | -1.315 | -1.157 | -1.032 | -0.620 |
| -N-P | 0.000 | -2.480 | -2.142 | -1.427 | -1.114 | -1.060 | -0.997 | -0.843 | -0.850 |
|
-N+P: Nitrogen starved in the presence of P-factor -N-P: Nitrogen starved in the absence of P-factor |