| 0 | 1 | 2 | 3 | 4 | 5 | 6 | 7 | 8 | |
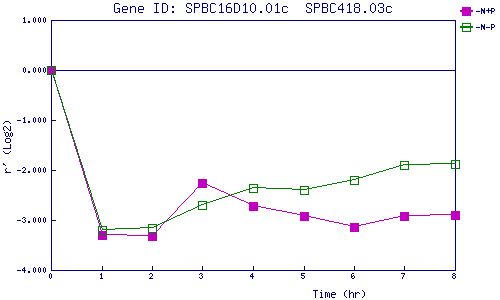
| -N+P | 0.000 | -3.292 | -3.317 | -2.260 | -2.725 | -2.921 | -3.136 | -2.920 | -2.896 |
| -N-P | 0.000 | -3.205 | -3.167 | -2.693 | -2.359 | -2.407 | -2.206 | -1.891 | -1.882 |
|
-N+P: Nitrogen starved in the presence of P-factor -N-P: Nitrogen starved in the absence of P-factor |