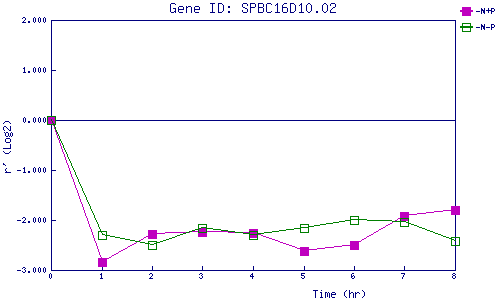
| 0 | 1 | 2 | 3 | 4 | 5 | 6 | 7 | 8 | |
| -N+P | 0.000 | -2.844 | -2.277 | -2.244 | -2.261 | -2.628 | -2.508 | -1.911 | -1.797 |
| -N-P | 0.000 | -2.307 | -2.491 | -2.158 | -2.293 | -2.164 | -1.991 | -2.037 | -2.415 |
|
-N+P: Nitrogen starved in the presence of P-factor -N-P: Nitrogen starved in the absence of P-factor |