| 0 | 1 | 2 | 3 | 4 | 5 | 6 | 7 | 8 | |
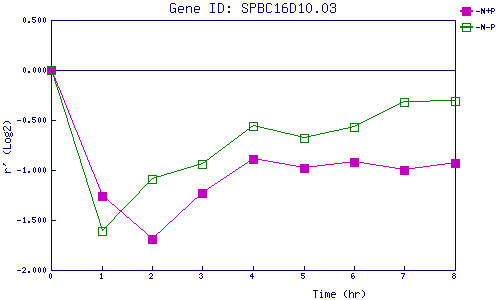
| -N+P | 0.000 | -1.263 | -1.688 | -1.230 | -0.887 | -0.975 | -0.922 | -0.997 | -0.930 |
| -N-P | 0.000 | -1.612 | -1.086 | -0.939 | -0.557 | -0.681 | -0.568 | -0.323 | -0.314 |
|
-N+P: Nitrogen starved in the presence of P-factor -N-P: Nitrogen starved in the absence of P-factor |
