dna2
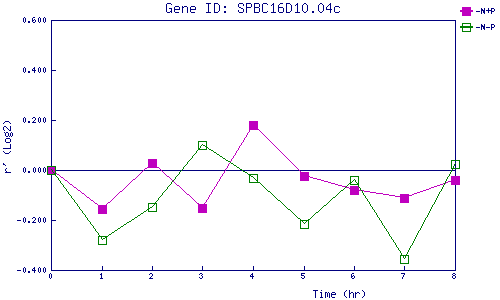
| 0 | 1 | 2 | 3 | 4 | 5 | 6 | 7 | 8 | |
| -N+P | 0.000 | -0.156 | 0.027 | -0.150 | 0.179 | -0.022 | -0.082 | -0.114 | -0.041 |
| -N-P | 0.000 | -0.281 | -0.149 | 0.101 | -0.031 | -0.218 | -0.041 | -0.356 | 0.022 |
|
-N+P: Nitrogen starved in the presence of P-factor -N-P: Nitrogen starved in the absence of P-factor |