| 0 | 1 | 2 | 3 | 4 | 5 | 6 | 7 | 8 | |
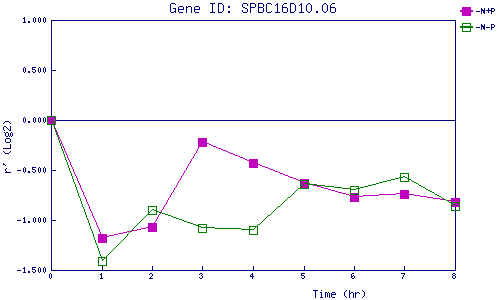
| -N+P | 0.000 | -1.177 | -1.066 | -0.220 | -0.433 | -0.626 | -0.771 | -0.743 | -0.818 |
| -N-P | 0.000 | -1.411 | -0.898 | -1.081 | -1.102 | -0.636 | -0.704 | -0.566 | -0.863 |
|
-N+P: Nitrogen starved in the presence of P-factor -N-P: Nitrogen starved in the absence of P-factor |