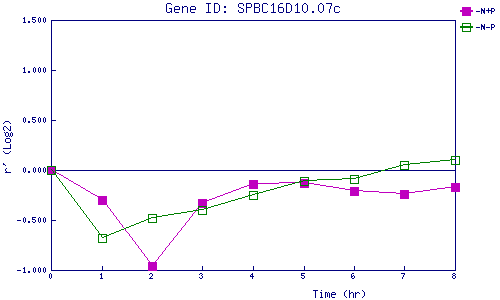
| 0 | 1 | 2 | 3 | 4 | 5 | 6 | 7 | 8 | |
| -N+P | 0.000 | -0.301 | -0.959 | -0.329 | -0.136 | -0.132 | -0.212 | -0.244 | -0.169 |
| -N-P | 0.000 | -0.682 | -0.481 | -0.399 | -0.252 | -0.112 | -0.093 | 0.050 | 0.096 |
|
-N+P: Nitrogen starved in the presence of P-factor -N-P: Nitrogen starved in the absence of P-factor |