pcn1 pcn
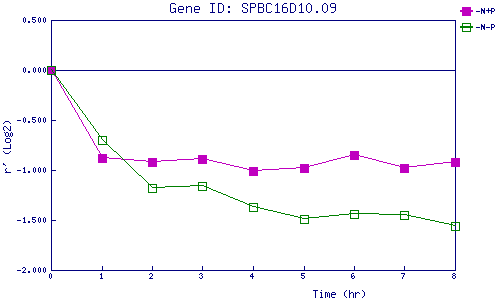
| 0 | 1 | 2 | 3 | 4 | 5 | 6 | 7 | 8 | |
| -N+P | 0.000 | -0.885 | -0.923 | -0.894 | -1.008 | -0.985 | -0.848 | -0.981 | -0.920 |
| -N-P | 0.000 | -0.700 | -1.179 | -1.156 | -1.366 | -1.487 | -1.435 | -1.450 | -1.561 |
|
-N+P: Nitrogen starved in the presence of P-factor -N-P: Nitrogen starved in the absence of P-factor |