rps18-1 rps1801
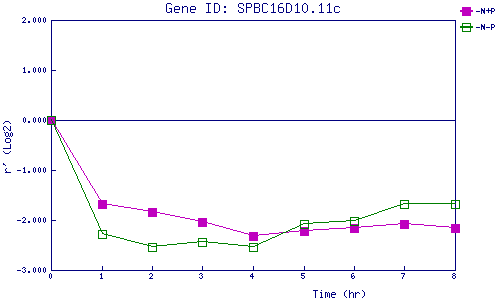
| 0 | 1 | 2 | 3 | 4 | 5 | 6 | 7 | 8 | |
| -N+P | 0.000 | -1.680 | -1.847 | -2.041 | -2.312 | -2.215 | -2.157 | -2.090 | -2.166 |
| -N-P | 0.000 | -2.272 | -2.542 | -2.443 | -2.545 | -2.085 | -2.011 | -1.670 | -1.688 |
|
-N+P: Nitrogen starved in the presence of P-factor -N-P: Nitrogen starved in the absence of P-factor |