uvi31
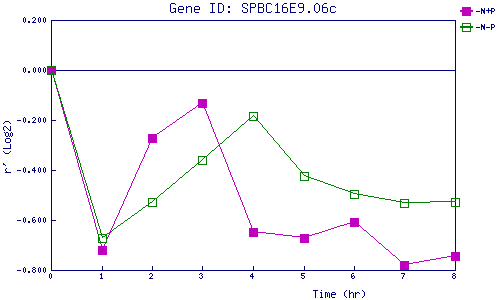
| 0 | 1 | 2 | 3 | 4 | 5 | 6 | 7 | 8 | |
| -N+P | 0.000 | -0.720 | -0.272 | -0.133 | -0.648 | -0.671 | -0.609 | -0.779 | -0.743 |
| -N-P | 0.000 | -0.670 | -0.529 | -0.361 | -0.185 | -0.422 | -0.497 | -0.532 | -0.526 |
|
-N+P: Nitrogen starved in the presence of P-factor -N-P: Nitrogen starved in the absence of P-factor |