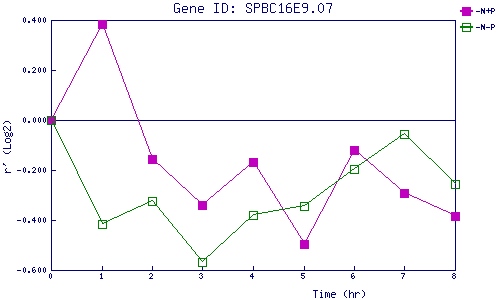
| 0 | 1 | 2 | 3 | 4 | 5 | 6 | 7 | 8 | |
| -N+P | 0.000 | 0.384 | -0.156 | -0.341 | -0.168 | -0.497 | -0.121 | -0.293 | -0.384 |
| -N-P | 0.000 | -0.414 | -0.324 | -0.567 | -0.380 | -0.342 | -0.196 | -0.054 | -0.258 |
|
-N+P: Nitrogen starved in the presence of P-factor -N-P: Nitrogen starved in the absence of P-factor |