| 0 | 1 | 2 | 3 | 4 | 5 | 6 | 7 | 8 | |
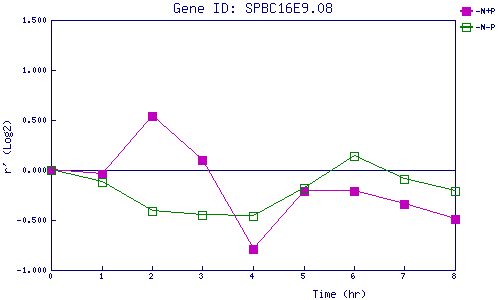
| -N+P | 0.000 | -0.044 | 0.543 | 0.102 | -0.794 | -0.210 | -0.210 | -0.345 | -0.487 |
| -N-P | 0.000 | -0.123 | -0.411 | -0.452 | -0.461 | -0.180 | 0.145 | -0.086 | -0.214 |
|
-N+P: Nitrogen starved in the presence of P-factor -N-P: Nitrogen starved in the absence of P-factor |