pab2
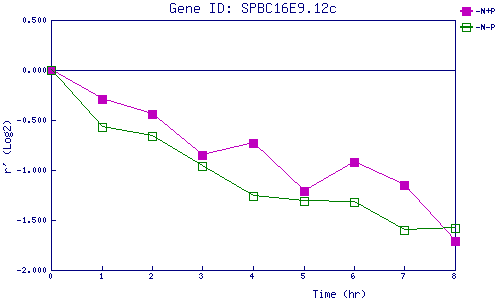
| 0 | 1 | 2 | 3 | 4 | 5 | 6 | 7 | 8 | |
| -N+P | 0.000 | -0.289 | -0.445 | -0.854 | -0.727 | -1.209 | -0.921 | -1.148 | -1.711 |
| -N-P | 0.000 | -0.567 | -0.661 | -0.958 | -1.255 | -1.308 | -1.318 | -1.603 | -1.580 |
|
-N+P: Nitrogen starved in the presence of P-factor -N-P: Nitrogen starved in the absence of P-factor |