mts3 rpn12
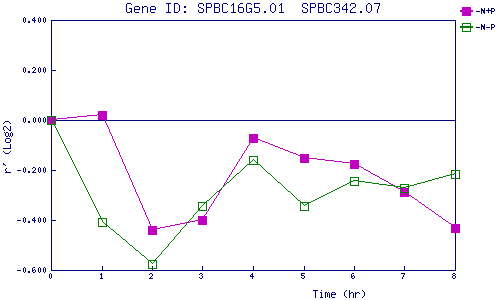
| 0 | 1 | 2 | 3 | 4 | 5 | 6 | 7 | 8 | |
| -N+P | 0.000 | 0.019 | -0.441 | -0.399 | -0.071 | -0.151 | -0.177 | -0.287 | -0.433 |
| -N-P | 0.000 | -0.408 | -0.575 | -0.343 | -0.161 | -0.342 | -0.244 | -0.272 | -0.214 |
|
-N+P: Nitrogen starved in the presence of P-factor -N-P: Nitrogen starved in the absence of P-factor |