| 0 | 1 | 2 | 3 | 4 | 5 | 6 | 7 | 8 | |
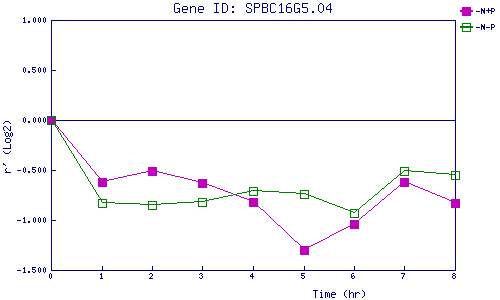
| -N+P | 0.000 | -0.622 | -0.513 | -0.628 | -0.818 | -1.304 | -1.035 | -0.616 | -0.829 |
| -N-P | 0.000 | -0.831 | -0.846 | -0.821 | -0.706 | -0.736 | -0.932 | -0.509 | -0.546 |
|
-N+P: Nitrogen starved in the presence of P-factor -N-P: Nitrogen starved in the absence of P-factor |