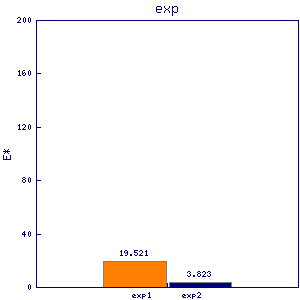
trp4
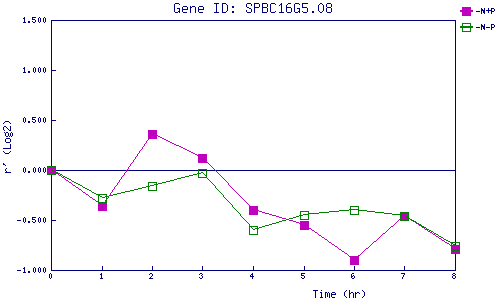
| 0 | 1 | 2 | 3 | 4 | 5 | 6 | 7 | 8 | |
| -N+P | 0.000 | -0.363 | 0.358 | 0.121 | -0.400 | -0.546 | -0.904 | -0.460 | -0.791 |
| -N-P | 0.000 | -0.285 | -0.159 | -0.028 | -0.598 | -0.447 | -0.396 | -0.465 | -0.764 |
|
-N+P: Nitrogen starved in the presence of P-factor -N-P: Nitrogen starved in the absence of P-factor |