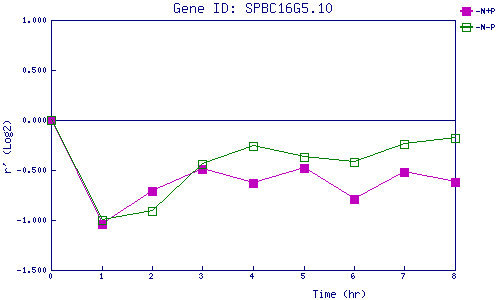
| 0 | 1 | 2 | 3 | 4 | 5 | 6 | 7 | 8 | |
| -N+P | 0.000 | -1.044 | -0.712 | -0.489 | -0.626 | -0.482 | -0.792 | -0.522 | -0.621 |
| -N-P | 0.000 | -1.003 | -0.909 | -0.445 | -0.255 | -0.370 | -0.421 | -0.238 | -0.185 |
|
-N+P: Nitrogen starved in the presence of P-factor -N-P: Nitrogen starved in the absence of P-factor |