bag1-a bag101 bag1
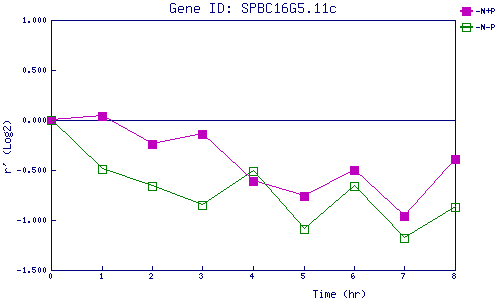
| 0 | 1 | 2 | 3 | 4 | 5 | 6 | 7 | 8 | |
| -N+P | 0.000 | 0.036 | -0.239 | -0.144 | -0.611 | -0.756 | -0.496 | -0.957 | -0.389 |
| -N-P | 0.000 | -0.490 | -0.659 | -0.852 | -0.507 | -1.086 | -0.661 | -1.183 | -0.866 |
|
-N+P: Nitrogen starved in the presence of P-factor -N-P: Nitrogen starved in the absence of P-factor |