top3
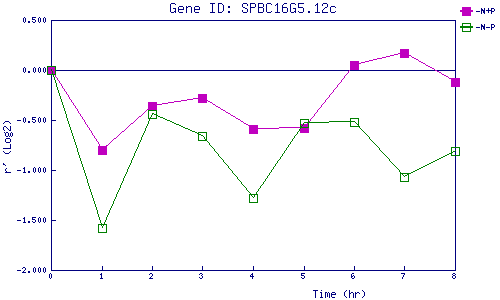
| 0 | 1 | 2 | 3 | 4 | 5 | 6 | 7 | 8 | |
| -N+P | 0.000 | -0.795 | -0.365 | -0.284 | -0.592 | -0.581 | 0.051 | 0.166 | -0.124 |
| -N-P | 0.000 | -1.575 | -0.443 | -0.662 | -1.275 | -0.530 | -0.525 | -1.068 | -0.812 |
|
-N+P: Nitrogen starved in the presence of P-factor -N-P: Nitrogen starved in the absence of P-factor |