rps3
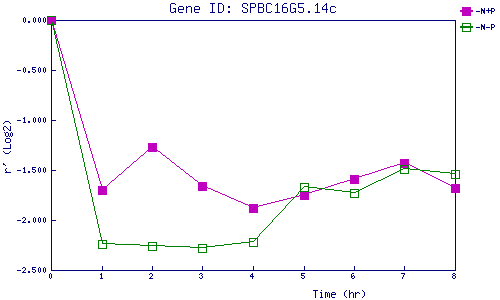
| 0 | 1 | 2 | 3 | 4 | 5 | 6 | 7 | 8 | |
| -N+P | 0.000 | -1.697 | -1.267 | -1.662 | -1.878 | -1.753 | -1.592 | -1.426 | -1.679 |
| -N-P | 0.000 | -2.239 | -2.261 | -2.285 | -2.218 | -1.668 | -1.731 | -1.486 | -1.543 |
|
-N+P: Nitrogen starved in the presence of P-factor -N-P: Nitrogen starved in the absence of P-factor |