| 0 | 1 | 2 | 3 | 4 | 5 | 6 | 7 | 8 | |
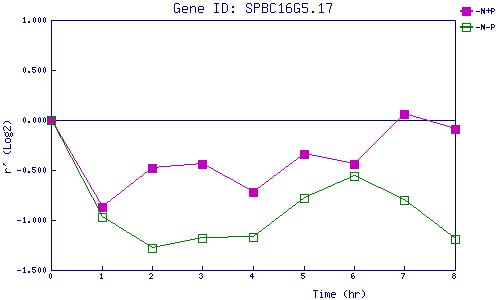
| -N+P | 0.000 | -0.869 | -0.477 | -0.440 | -0.721 | -0.339 | -0.443 | 0.056 | -0.090 |
| -N-P | 0.000 | -0.971 | -1.281 | -1.175 | -1.166 | -0.777 | -0.556 | -0.797 | -1.189 |
|
-N+P: Nitrogen starved in the presence of P-factor -N-P: Nitrogen starved in the absence of P-factor |