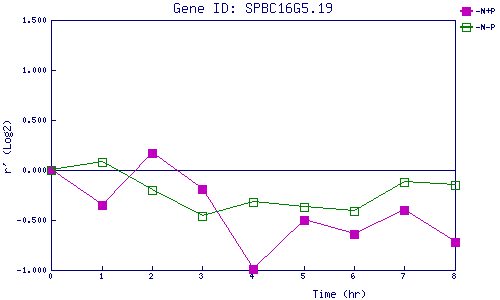
| 0 | 1 | 2 | 3 | 4 | 5 | 6 | 7 | 8 | |
| -N+P | 0.000 | -0.353 | 0.174 | -0.194 | -0.990 | -0.501 | -0.643 | -0.405 | -0.716 |
| -N-P | 0.000 | 0.085 | -0.204 | -0.459 | -0.320 | -0.369 | -0.410 | -0.117 | -0.154 |
|
-N+P: Nitrogen starved in the presence of P-factor -N-P: Nitrogen starved in the absence of P-factor |