| 0 | 1 | 2 | 3 | 4 | 5 | 6 | 7 | 8 | |
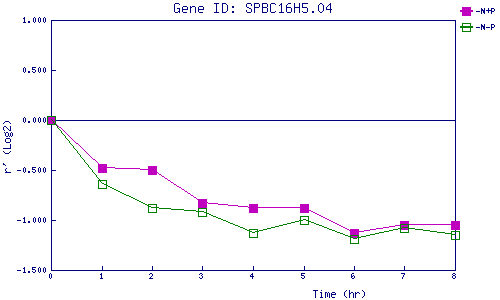
| -N+P | 0.000 | -0.483 | -0.495 | -0.828 | -0.882 | -0.882 | -1.131 | -1.053 | -1.053 |
| -N-P | 0.000 | -0.645 | -0.875 | -0.916 | -1.130 | -0.997 | -1.190 | -1.079 | -1.153 |
|
-N+P: Nitrogen starved in the presence of P-factor -N-P: Nitrogen starved in the absence of P-factor |